Takayuki Koizumi, Nobutaka Tujiuchi, Yukimitsu Tomita, Department of mechanical engineering, Doshisha University, Japan
Hiroaki Andou, Caterpillar Japan Ltd. –
The article discusses a digging performance simulation process using a discrete element method.
Environmental protection is one of the major concerns for the development of any kind of industrial product. Thus the simulation process must be able to accurately predict the digging performance before tests on the machine’s prototype. In this survey, an attempt was made to objectively evaluate productivity through the productivity index calculated by DEM method.
DEM theory
Basic algorithm
The forces acting on the particles during motion are solved in DEM using Newton’s equation of motion. Such motions shall be calculated by integrating the stress tensor over time. When the particles come in contact one another, the forces of repulsion, bonding and friction interact. Particles are assumed as rigid bodies that can be penetrated. If particles come into contact one another, the repulsion force is calculated using Hooke’s law. In addition to repulsion forces also friction forces act among the particles.
Digging simulation model
Simulation model
In digging simulations, bucket and soil have been represented by particles. The ratio between digging trajectory and productivity has been assessed based on the amount of dug soil and resistance force that acts on the bucket during digging. This simulation method through DEM has facilitated the calculation of material volume collected by the bucket and the variations of the bucket’s geometry; the parameters of soil and bucket were defined as constant values.
Simulation model
Soil
The parameters of soil properties are given in table 1.
| Tab. 1 – SOIL CONDITIONS | ||
| Particle | Wall | |
| Radius | 7,5e-3 [m] | — |
| Density | 3e3 [kg/m3] | — |
| Young modulus | 4.9e6 [Pa] | 3.9e6 [Pa] |
| Poisson’s ratio | 0,23 | 0,25 |
| Damping factor | Minimum 5 [%] | |
| Friction | 0,7 | |
How to dig a slope:
1. the soil has been randomly placed in a container and dropped freely
2. The excess soil has been removed to create the slope.
The bucket
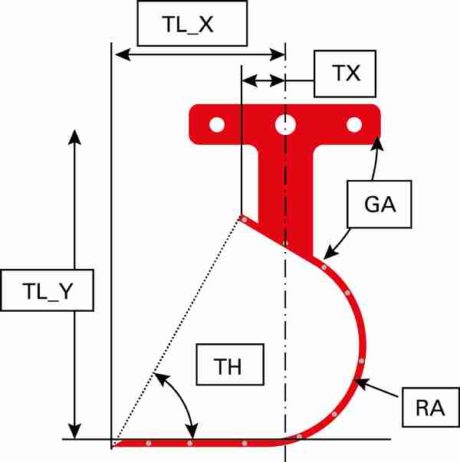
Bucket parameters are given in table 2. The dimensional drawing and layout of the particles are shown in figure 1.

The bucket’s geometry has been represented by identifying the particles depending on its size. Given its width, the bucket’s maximum loading capacity is 6.7 [kg].
| Tab. 2 – BUCKET PARAMETERS | |
| TL_X | 103,1 [mm] |
| TL_Y | 189,0 [mm] |
| TX | 103,1 [mm] |
| RA | 65,0 [mm] |
| Width | 185 [mm] |
| GA | 30,0 [°] |
| TH | 59,8 [°] |
Simplified method for digging trajectories
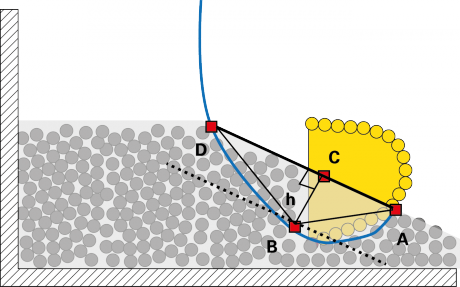
As first step for digging operation based on an intelligent standard algorithm, we have developed a simplified procedure in order to create digging trajectories; then we tried to understand the influence of trajectories on productivity with certain soil properties. Following this procedure four digging trajectories have been defined whose points of reference are shown in figure 2.

Technique for cell division list
The soil has been divided into several cells, and before digging, a list including the number of particles contained in each cell has been prepared.
For this simulation 5 × 5 cells have been considered with respect to a particle, so in order to calculate the reaction force n × 25 cells have been necessary with respect to n particles.
Evaluation of digging productivity
Parameters for productivity assessment
Payload
The soil found in the bucket at the end of a digging is considered payload V2D. Considering the bucket’s width, 3D payload is calculated.
Bucket’s driving force
It is possible to calculate the reaction force for a given section of the bucket or the force at its top as well as the reaction and friction forces received from the bottom. Arbitrary digging time t multiplied for the distance of the bucket’s particles from the rotation axis is determined by l, the reaction force is determined by Fi and the torque that has interacted with the axis is calculated by the following expression.
This is defined as the digging resistance torque and it indicates the digging performances.
Cumulative energy is calculated by multiplying this torque for the angle of rotation in order to solve time integration. The result of integration is considered as an energy carrier.
Productivity assessment
Productivity is the ratio between payload and driving force in a digging. The higher this index, the higher the load displaced by the same driving energy, and the higher is productivity. Digging time is determined by the bucket’s time displacement (0 ~ n) from A to D.
Results
Evaluation of productivity for arbitrary digging profiles
Four simple bucket trajectories have been developed and assessed. “Speed” was set to 0.1 [m/s], while for “digging depth” and “bucket filling ratio” two levels have been set. “Depth” was set to 0.07 and 0.1 [m], while “ratio” to 30 and 70 [%]. Trajectory parameters are shown in table 3. The results are interesting and make it possible to assess the influence of these parameters on payload, energy and productivity.
| Tab. 3 – PARAMETERS OF DIGGING EXAMPLES | ||||
| Trajectory | Speed [m/s] | Depth [m] | Ratio [%] | Productivity [kg/J] |
| 1 | 0,1 | 0,07 | 30 | 4.169 |
| 2 | 0,1 | 0,07 | 70 | 3.673 |
| 3 | 0,1 | 0,1 | 30 | 4.321 |
| 4 | 0,1 | 0,1 | 70 | 2.987 |
Influence of speed on the trajectory
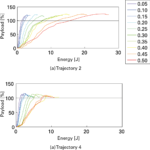
We compared the influence of speed on individual trajectories. Figure 3 (a) and (b) show the payload compared to energy for two different trajectories. The lines indicate the speed with time lags of 0.05 [m/s]; the higher the speed, the lightest the colors of the lines. Checking digging productivity is easy and possible to be quantitatively assessed.

Conclusions
Soil and trajectory influence digging performance. The shape of the bucket is considered an additional reason for difference between the obtained results. The trajectories that imply rapid bucket rotation have less productivity. Linear trajectory, in which there are no rapid bucket rotations and payload increases gradually, as well as the bucket’s driver force, shows high productivity.


